Visual Representations in Science Learning
Contents
Visual Representations in Science Learning
Jodi Davenport
Abstract
Visual representations, in the forms of diagrams, notation (e.g., equations), graphs and tables are fundamental tools in science instruction and practice. Whether diagrams or notational systems are helpful aids to problem solving depends critically on the content of the visual representation and how learners are able to process the information they contain. Expert/novice studies have demonstrated that different levels of experience with result in differential processing of the same stimuli. However, it is not known how students are able to refine initially shallow understandings into meaningful chemical concepts.
The current project seeks to determine when and how the use of multiple representations during instruction and problem solving will lead to robust learning. Two types of studies are currently running that investigate student learning at the two levels (micro and macro) of the theoretical framework. At the microscopic level, knowledge components in the domain of equilibrium chemistry are identified through verbal protocol studies and a working collaboration with Chemistry and Education faculty. For instance, a verbal protocol study has demonstrated that experts and novices differ in their ability to invoke relevant knowledge components in contexts involving different representations (e.g., chemical equations, graphs, and diagrams). At the macroscopic level, in vivo studies investigate whether molecular diagrams improve learning in tutorials on acids and bases and buffer systems through coordinative learning. To date, our studies have not demonstrated a learning advantage for molecular diagrams.
Glossary
Visual representations: External representations that are used in instruction and problem solving such as diagrams, graphs, and equations
Research Questions
What are the knowledge components of equilibrium and acid base chemistry? How do multiple representations influence how chemical understanding is acquired and accessed? When and how does the presence of visual representations in addition to textual information promote robust learning in Chemistry?
Background and Significance
In a number of laboratory studies, Mayer (Clark & Mayer, 2003), Ainsworth & Loizou (2003) and others have found that instructional materials that include both diagrams and text provide learning benefits over materials that only include text. Will this same learning advantage extend to classroom-based instruction? Studies in chemistry education research have suggested that molecular level diagrams may promote deeper understanding that text or equations. However, these classroom-based studies lacked rigorous controls and assessments of robust learning. The current project investigates if and when the presence of visual representations in addition to text promotes deep conceptual understanding in chemistry.
Dependent Variables
Dependent variables include improvement from pre to post test on conceptual multiple choice questions, performance on scaffolded problem solving with tutors and performance on open-ended transfer questions.
Independent Variables
The studies in the project manipulate the presence of visual representations in chemistry instruction and problem solving.
Hypothesis
Presenting visual representations along with textual explanations during instruction and problem solving will lead to a deeper, more conceptual understanding of chemistry concepts as measured by improved performance on conceptual multiple choice and scaffolded problem solving items and promote robust learning as measured by performance on open-ended transfer questions.
Findings
Microscopic Level
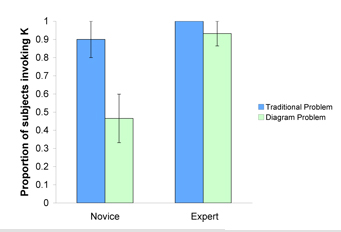
Does problem representation influence the retrieval of knowledge components? Experts and novices solved equilibrium problems in different contexts while talking aloud. While experts were equally able to retrieve the correct knowledge component (in this case that the equilibrium constant, K, was required for problem solving), novices were able to retrieve the correct knowledge component when solving a traditional problem, but were less successful on problems using molecular-level diagrams.
Macroscopic Level
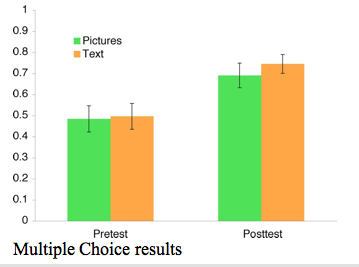
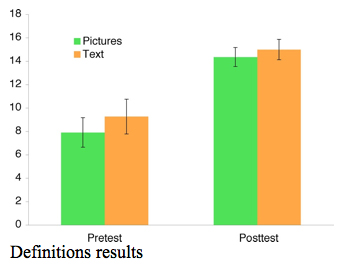
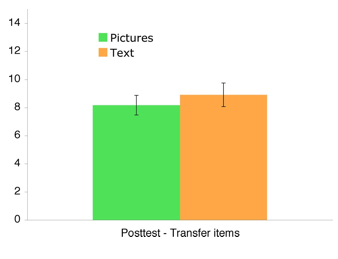
To date, results suggest no advantage for the addition of visual representations. Specifically, acid/base chemistry tutorials that included molecular-level diagrams did not produce enhanced learning compared with text-only versions of the same tutorials. Future studies will investigate whether labelled diagrams will be more likely to promote integration of textual material with visual representations, leading to more robust learning of chemistry concepts. To date, three studies (2 in vivo at UBC and CMU and 1 lab study at CMU) have been run using tutorials on acid and bases and buffer solutions (types of equilibrium systems). While participants in each study showed significant learning gains from pre to posttest, no study has shown a selective learning advantage when diagrams are present.
As the pattern of results was similar in each study, figures from the CMU lab study are shown.
Explanation
If an effect of visual representations is found, it is hypothesized that coordinating text and molecular level diagrams promotes robust learning via sense making. Molecular-level diagrams provide concrete examples that can be linked with more abstract chemical equations. The practice of linking abstract notations (in equations) to representations that depict individual molecules should help students develop a deeper, more conceptual understanding of chemistry.


